
CDM Validator
This is a tool for checking the compliance of a georeferenced file against the “Climate and Forecast” Convention CF-1.0.
The usefulness of this tool will be readily apparent to anyone who wants to quickly network files under point “1” (TDS), and has not previously set up their outputs according to the CF Convention.
ChirCor
ChirCor, a program developed by Luca Gasperini of ISMAR, for managing physical-log data (P-wave velocity and density) and chirp-sonar seismograms, also equipped with a synthetic-trace generator, that could be used for correlating real seismograms to synthetics. The software, designed with a user-friendly graphic interface, is intended mainly for oceanographers and marine geologists as a tool for correlating high-resolution seismic images and sediment cores.
Bibliografic reference: Dal Forno G., Gasperini L. ChirCor: A new tool for generating synthetic chirp-sonar seismograms. In: Computers & Geosciences, vol. 34 (2) pp. 103 – 114. Pergamon-elsevier Science Ltd, 2008.
PUMA reference: cnr.ismar.bo/2008-A0-046
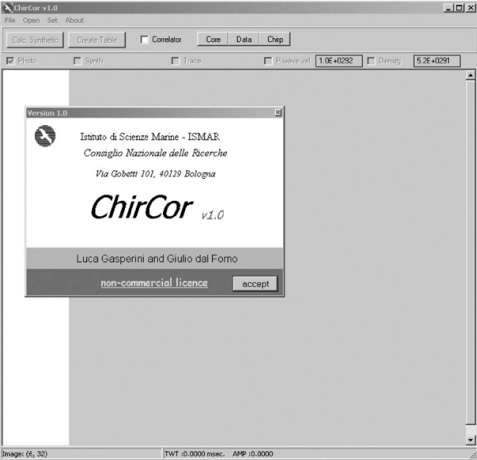
Photo 01:
A snapshot of main window of ChirCor v1.0.
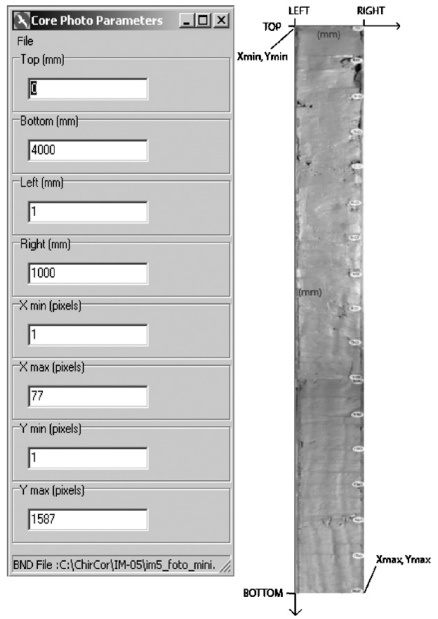
Photo 02:
To the left, Core Photo Parameters form, with all edit boxes used to reference core image. To the right, a sample core image with all parameters indicated. Note that the origin of image coordinates is at the upper-left corner of the Bitmap image.
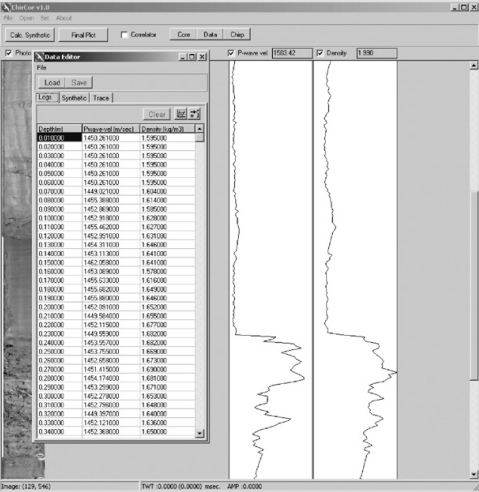
Photo 03:
Data Editor form opened over main window. Once the log file is loaded using Data Editor, graphs are automatically updated in the main form.
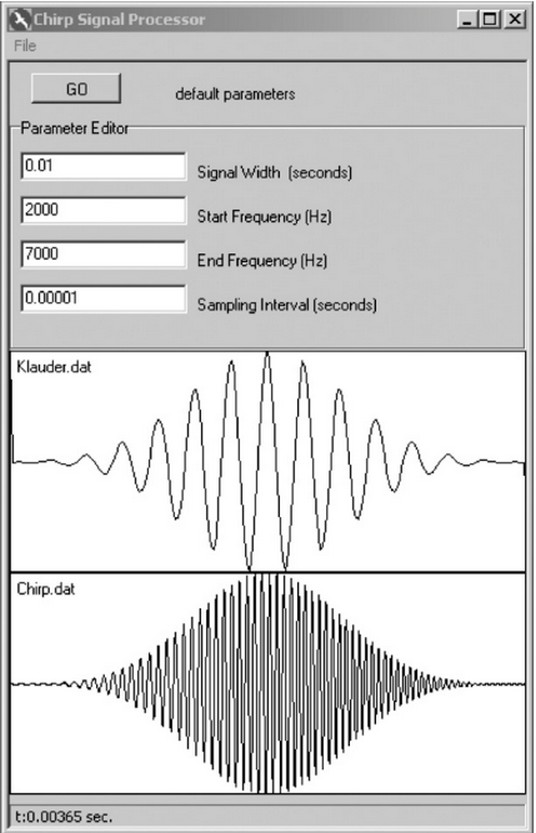
Photo 04:
Chirp Signal Processor form; parameters can be edited using text boxes and eventually saved in a text file (*.SIG).
Synthetic generation is performed at a “GO” button click. The lower part of the form shows Klauder wavelet (upper) and chirp sweep (lower) graphs that are automatically updated at chirp signal generation.
Map algebra for granulometry
The development of spatial modelling in a Geographical Information System (GIS) can assist in treating, computing and displaying sedimentological data, such as grain-sizes.
In this work, four map algebra (MA) algorithms are written in a GIS environment to automatically produce maps depicting the spatial distribution of sediment texture classes based on the most frequently used grain-size TD: the Shepard (1954) classification, Flemming (2000) classification for sand/silt/clay components, and Folk et al. (1970) classification Blair and McPherson (1999) classification for sand/gravel/mud components. The proposed method allows rapid assessments by producing map distributions of the parameters most widely used in sedimentology. The algorithm is extremely flexible in terms of the input of end-members, and may therefore be applied to several fields in Earth Sciences, such as geochemistry, sedimentology or paleontology.
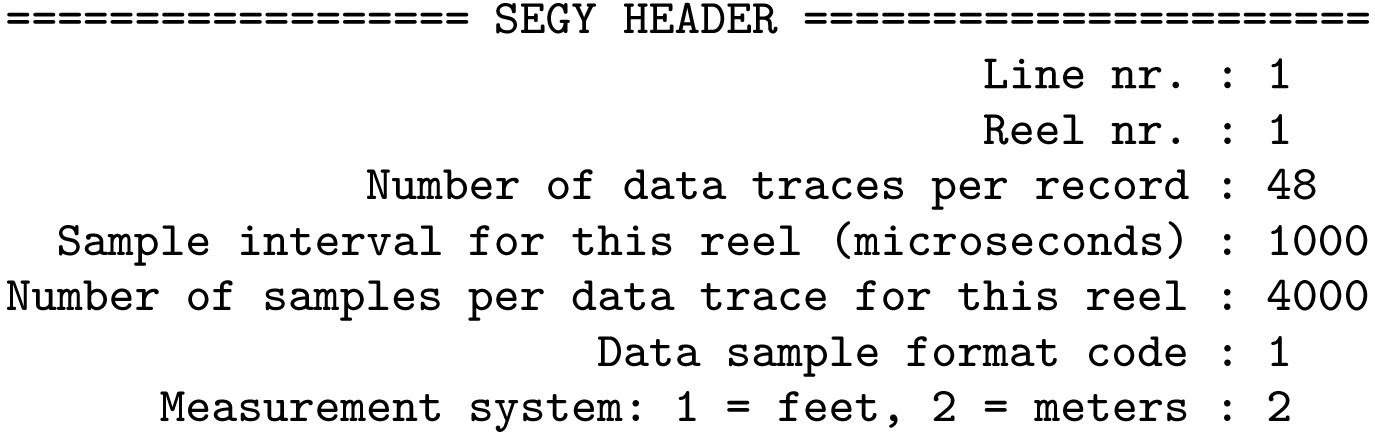
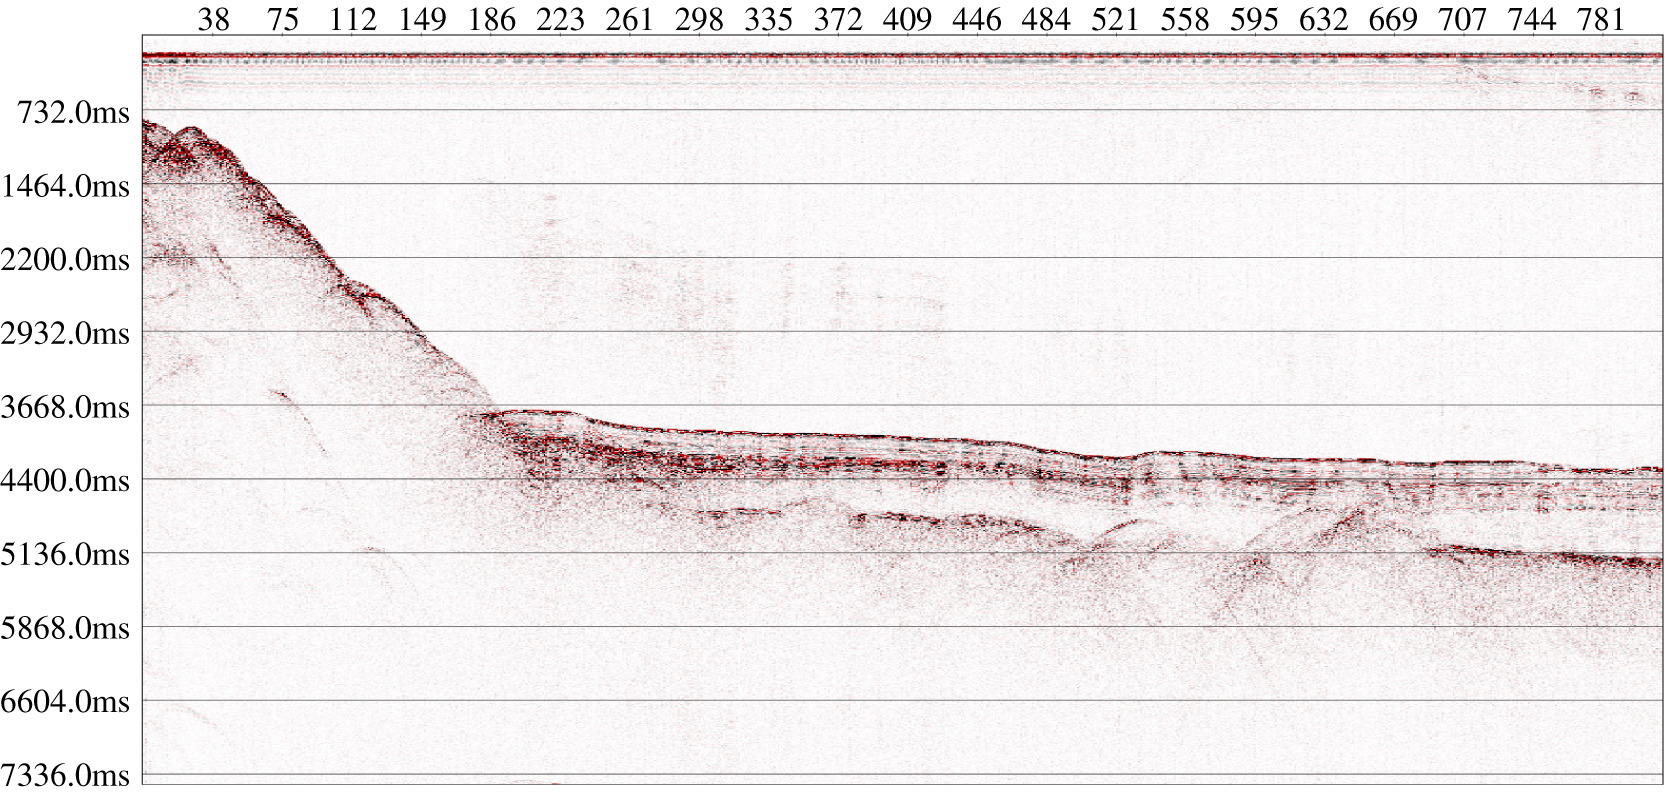
Segy-change
Data collected during active and passive seismic surveys can be stored in many different, more or less standard, formats. One of the most popular is the SEG-Y format, developed since 1975 to store single-line seismic digital data on tapes, and now evolved to store them into hard-disk and other media as well. Unfortunately, sometimes, files that are claimed to be recorded in the SEG-Y format cannot be processed using available free or industrial packages. Aiming to solve this impasse we present segy-change, a pre-processing software program to view, analyze, change and fix errors present in SEG-Y data files. It is written in C language and it can be used also as a software library and is compatible with most operating systems. Segy-change allows the user to display and optionally change the values inside all parts of a SEG-Y file: the file header, the trace headers and the data blocks. In addition, it allows to do a quality check on the data by plotting the traces. We provide instructions and examples on how to use the software
Bibliographic reference: Giuseppe Stanghellini, Gabriela Carrara “Segy-change: The swiss army knife for the SEG-Y files”, SoftwareX, vol. 6 pp. 42-47 Pergamon-elsevier Science Ltd, 2017.
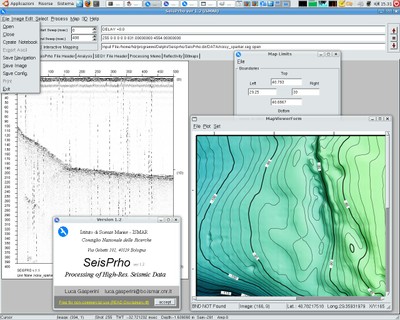
SeisPrho
SeisPrho is an interactive computer program for processing and interpreting high-resolution seismic reflection profiles developed using the Delphi/Kylix multiplatform programming environment.
For this reason, it is available under Windows? and Linux? operating systems. The program allows the users to handle SEG-Y data files (and other non-standard formats) carrying out a processing sequence over the data to obtain, as a final result, bitmap images of seismic sections. Some basic algorithms are implemented, including filtering and deconvolution. However, the main feature of SeisPrho is its interactive graphic interface, which provides the user with several tools for interpreting the data, such as reflector picking and map digitizing. Moreover, the program allows importing and geo-referencing maps and seismic profiles in the form of digital images. Trace-by-trace analysis of seismic signal and sea-bottom reflectivity is also implemented, as well as other special functions such as compilation of time-slice maps from close-spaced grids of seismic lines. SeisPrho is distributed as public domain software for non-commercial purposes by the Marine Geology division of the Istituto di Scienze Marine (ISMAR-CNR). This paper is an introduction to the program and a preliminary guide to the users.
Bibliographic reference: Computers & Geosciences, vol. 35 (7) pp. 1497 – 1507. Pergamon-elsevier Science Ltd, 2009.
Photo 01:
A snapshot of SeishPrho main window
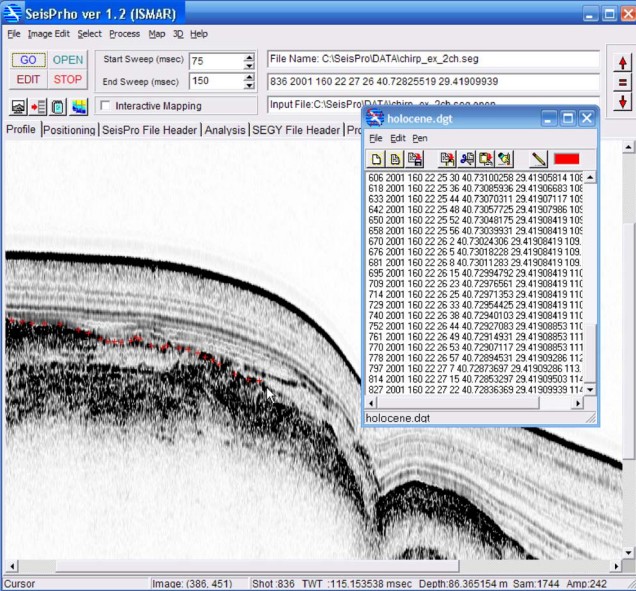
Photo 02:
Reflector picking after Notepad opening. DGT extension for output files enables inclusion of all parameters in the text string. Picking is carried out using point-by-point mode, activate by SHIFT+Left keys.
Photo 03:
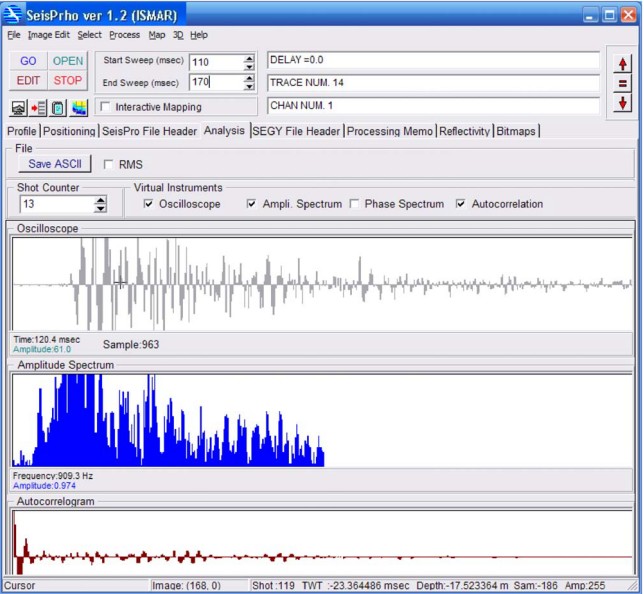
Signal Analysis panel. Virtual instruments are opened by checking check-boxes on top of the Panel.
Photo 04:
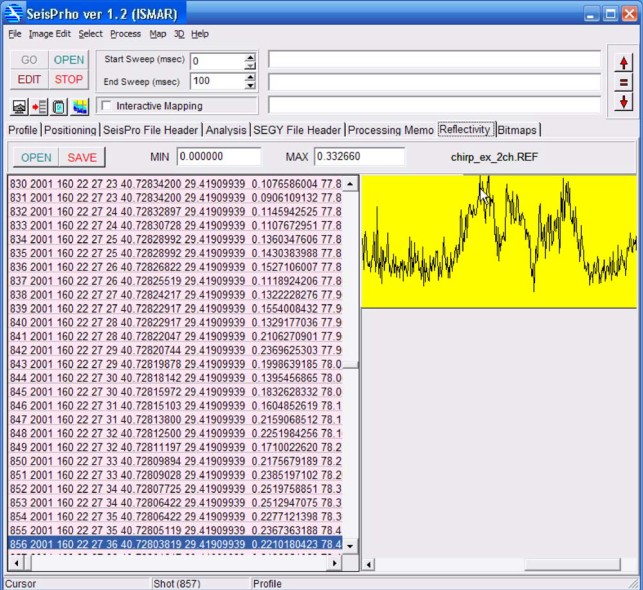
Reflectivity analysis panel. Each data row (on the left) could be selected by moving mouse pointer over graph on the right.
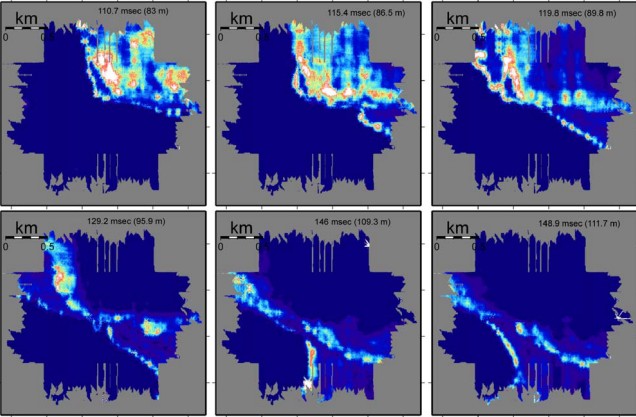
Photo 05:
Example of time-slice map obtained using the 3D SeisPrho function.
SHYFEM
The finite element program SHYFEM is a program package that can be used to resolve the hydrodynamic equations in lagoons, coastal seas, estuaries and lakes. The program uses finite elements for the resolution of the hydrodynamic equations. These finite elements, together with an effective semi-implicit time resolution algorithm, makes this program especially suitable for application to a complicated geometry and bathymetry.
Thredds Data Server (TDS)
It provides OPENDAP- and WMS-type “facilitated” access to some numerical simulation results.
Interested users will thus be able to download, for example via MATLAB, only portions of datasets relevant to their needs or connect to them directly with IDV-type clients.
Through a viewer present directly on the site (GODIVA2), it will also be possible to access the VMS service related to these cases, and to visualize in a simple and intuitive way the results without necessarily “going into the merits” of the format in which these data were stored.
We believe that this is *a great step toward popularizing ISMAR products in general*, for now mainly modeling in nature.
The service is in the testing phase and the datasets are quite large, so be patient for viewing!
If anyone else in ISMAR has activated a similar type of service, please remember that it is possible to import and export remote catalogs without particular problems.
(e.g., datasets related to bathymetry provided by the USGS are currently imported on the TDS).
(e.g., click then on “Field”, then on “FIELD_AC Test Run1”, scroll down the metadata page to the bottom on “Wievers” and try clicking on “GODIVA2”.
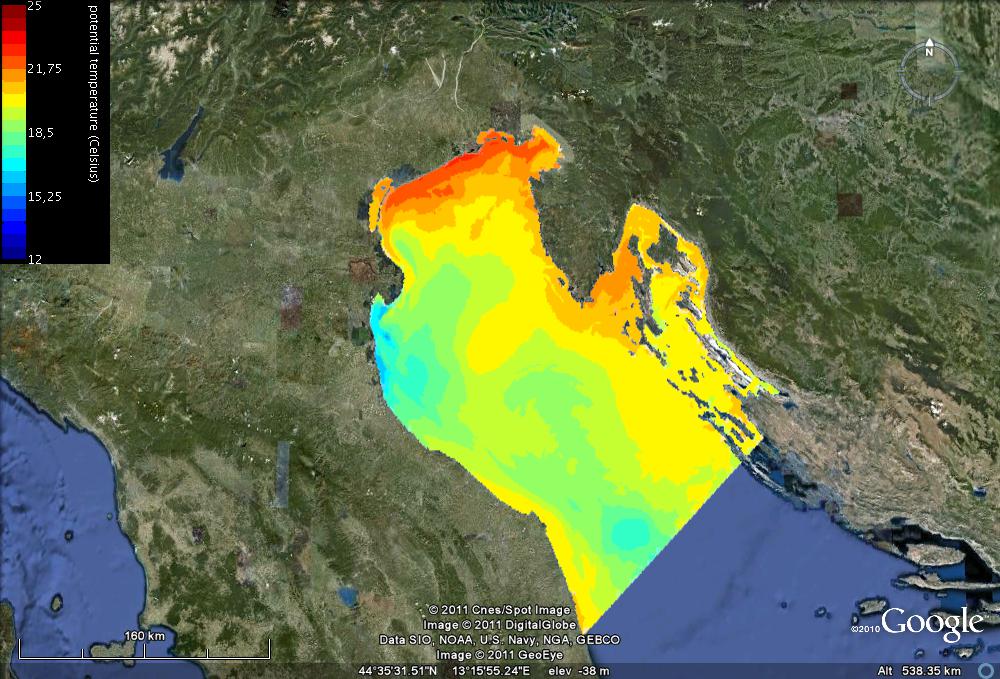
“The world” will appear: click on the “Idealized Coastal Shelf” menu and choose e.g. the variable “potential temperature.”
The surface temperature field will be displayed, as per the specifice expressed above the figure itself (this is a North Adriatic run at 500 m resolution made with the ROMS model, year 2007). You can easily compose animations as well, oppur explore the 3D field of modeled variables…
Then if you really want to go overboard, BELOW the figure click on “Open in Google Earth” and you will appreciate another of the possibilities this system offers!
The image on the side is an example of the temperature obtained with these 4 simple clicks…anyone who has only requested or tried to visualize numerical results from some modeler during his or her career will appreciate the leap forward that TDS allows in terms of simplicity and dissemination of numerical data!